
|
Quadratic Functions
|

|
SAT Practice Question: The following equation shows the height, \(h\), in meters above the ground of a football \(t\) seconds after a particular kick.
\(h=0.3+5.5t-4.9t^2\) What was the height of the football at the moment of the kick? Answer: _______________meters Source: Khan Academy |
A quadratic function is a function whose graph is a parabola. In this section, we will learn how to graph parabolas when given the equation in standard form, vertex form, and intercept form.
Standard Form: \(f\left(x\right)=ax^2+bx+c\)
Vertex Form: \(f\left(x\right)=a\left(x-h\right)^2+k\)
Intercept Form: \(f\left(x\right)=a\left(x-p\right)\left(x-q\right)\)
Vertex Form: \(f\left(x\right)=a\left(x-h\right)^2+k\)
Intercept Form: \(f\left(x\right)=a\left(x-p\right)\left(x-q\right)\)
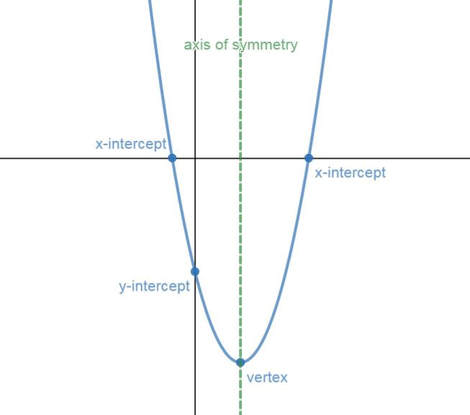
Before getting into specifics about how to graph the different representations, there are some common definitions that will be useful.
Vertex: The lowest or highest point on a parabola. This is the point where the graph changes direction.
Axis of Symmetry: The vertical line that passes through the vertex; it divides the parabola into mirror images.
Maximum: The highest point on the parabola--it occurs at the \(y\)-coordinate of the vertex. A parabola has a maximum if it opens down.
Minimum: The lowest point on the parabola--it occurs at the \(y\)-coordinate of the vertex. A parabola has a minimum if it opens up.
x-intercepts: The point or points where the parabola intersects the x-axis. (The value of \(x\) when \(y = 0\)). The x-intercepts are the real solutions to a quadratic equation.
Domain: The set of \(x\) values (inputs) for which the function is defined (in other words, the function provides a \(y\) value (output) for each \(x\) value (input)). The domain of a quadratic function is always the set of all real numbers.
Range: The set of \(y\) values (outputs) for each \(x\) value in the domain. The range of a quadratic function depends on the direction the parabola opens and the y-coordinate of the vertex.
Graphing in Standard Form
Graphing in Vertex Form
Graphing in Intercept Form
Graphing with the Calculator