
|
Statistics
|

|
At Nordstrom Rack you wait in one line to be checked out by the next available cashier. At Jewel you choose which cashier's line to wait in. Which type of line would you rather stand in? Justify your reasoning mathematically.
|
Now that we’ve talked a little bit about how surveys are conducted, we are going to look at different ways to summarize the data that is collected.
Statistics are numerical values used to summarize and compare sets of data.
Statistics are numerical values used to summarize and compare sets of data.
Measures of Central Tendency are numbers used to represent the center or middle of the data set. You have worked with all of these before but they are so important that we will review them.
Measure of Dispersion is a statistic that tells how dispersed, or spread out, the data values are.
- -Mean (\(\mu\) or \(\bar{x}\)): average...another way to think about this is what each data value would be if the sum of the data was redistributed to all of the values so they were equal (add all values then divide by total number of values in the data set)
- -Median: middle value if data is ordered from smallest to largest (if there are two middle numbers, find the average of those numbers)
- -Mode: number(s) that occurs most often in a data set (there can be one mode, multiple modes, or no mode)
Measure of Dispersion is a statistic that tells how dispersed, or spread out, the data values are.
- -Range: difference between the largest and smallest data values
- -Standard Deviation (\(\sigma\)) : typical difference (or deviation) between a data value and the mean
Example 1: Find the mean, median, mode, and range of the data set of prices of the ten most popular Starbucks drinks (in dollars): \(3.65, 4.15, 4.45, 2.10, 4.25, 4.15, 4.45, 4.55, 4.35, 4.95\)
- Mean: \(\large\frac{41.05}{10}=\normalsize4.105\) or about \(\$4.11\)
- Median: \(\large\frac{4.35+4.45}{2}=\normalsize4.40\)
- Mode: \(\$4.15\) and \(\$4.45\)
- Range: \(4.95-2.10=2.85\)
You can also use your calculator to find the mean and median. It won’t give you the mode or range, but it will give you the minimum and maximum to help find the range.
|
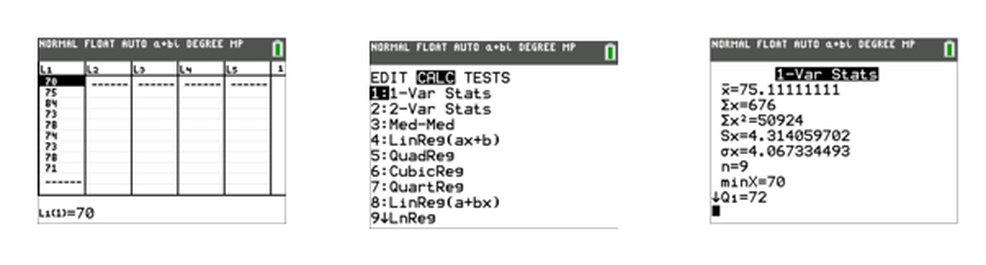
1) Press STAT then EDIT and enter the values into L1.
|
2) Press STAT then CALC and choose #1: 1-Var Stats.
|
3) The first number, \(\bar{x}\), is the mean. Scroll down to find the median (Med).
|
Let’s go back to the list of prices of Starbucks drinks. If we increased the price of each drink by \(\$0.10\), what would happen to the mean, median, mode, and range? We could take the time to raise each price by \(\$0.10\) and then recalculate everything, but we don’t need to do that. If each value is increased by a constant amount, then the mean, median, and mode will all increase by that same constant. However the range will remain unchanged since the difference between the greatest and least values will remain the same.
Starbucks decides to raise all of their prices by \(25\%\). What would then happen to the mean, median, mode, and range?