
|
Statistics
|

|
What questions do you have about this graph? Write at least three questions.
source 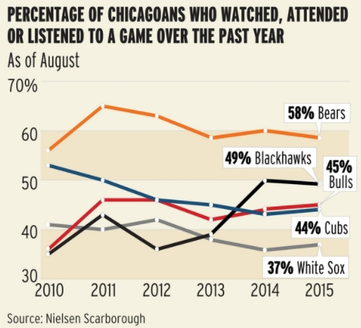
|
A USA Today Snapshots feature stated that \(49\%\) of Americans would have difficulty giving up their Smartphone.
In the above example, \(49\%\) is a parameter. It means that of all Americans, \(49\) out of every \(100\) would have difficulty giving up their Smartphone.
A proportion represents part of the whole and can be expressed as a fraction, decimal or percent. Proportions can also represent probabilities. In the above example, if one American is selected at random, the probability that he would have difficulty giving up his Smartphone is \(0.49\).
Proportions can be obtained from samples or populations. We will be working with sample proportions in this unit.
Symbols
\(p\) = population proportion
\(\hat{p}\) = sample proportion
For a Sample Proportion: \(\large{\hat{p}=\frac{X}{n}}\) where \(X\) is the number of successes and \(n\) is the sample size.
Example 1: In a recent survey of \(1006\) U.S. adults, \(875\) stated that they use the Internet. Find the sample proportion of U.S. adults who use the internet.
\(\large{\hat{p}=\frac{875}{1006}}\)
\(\hat{p}=0.86978\)
Approximately \(87\%\) of U.S. adults use the Internet.
Once we have our sample proportion, we can construct a confidence interval around that proportion. A confidence interval is an interval of plausible values for the true population proportion.
The most common confidence interval is \(95\%\). If we have a \(95\%\) confidence interval we say “We are \(95\%\) confident the true proportion (percent of population) will fall within \(2\) standard deviations of the sample proportion”. Keep in mind, we will never actually know the population proportion or if it actually falls within our confidence interval.
The most common confidence level is \(95\%\), but you can also construct intervals with different confidence levels.
Confidence Interval Formula: \(\hat{p}\pm z^{\ast}\sqrt{\large\frac{\hat{p}\left(1-\hat{p}\right)}{n}}\)
where \(\hat{p}\) is the sample proportion and \(z^*\) is the critical value based on the level of confidence desired. (You will notice later in this section that the endpoints of the confidence interval are found by adding and subtracting the margin of error from the sample proportion.)
where \(\hat{p}\) is the sample proportion and \(z^*\) is the critical value based on the level of confidence desired. (You will notice later in this section that the endpoints of the confidence interval are found by adding and subtracting the margin of error from the sample proportion.)
For \(95\%\) confidence, \(z^{\ast}=1.96\) (some books will use \(z^{\ast}=2\). I have been told that AP Stat classes will accept either). So for our purposes, we will use \(z^{\ast} = 1.96\). For any other level of confidence, you can find the critical value using your z-table.
Example 2: In a recent survey of \(1006\) U.S. adults, \(87\%\) said they used the internet. Construct the \(95\%\) confidence interval for the true proportion of U.S. adults who use the internet.
\(\begin{align}&\hat{p}=.87, n = 1006, z^{\ast} = 1.96\ & \ \ \ &\text{1) Identify the sample proportion, sample size and critical value.}\\
&0.87\pm1.96\sqrt{\frac{.87\left(1-.87\right)}{1006}}\ & \ \ \ &\text{2) Substitute the values in the formula.}\\
&0.87\pm0.0208\ & \ \ \ &\text{3) Perform the calculations.}\\
&0.87-0.0208=.8492\;\&\;\ 0.87+0.0208=0.8908\ & \ \ \ &\text{4) Subtract from}\ \hat{p}\ \text{& add to}\ \hat{p}.\\
&0.8492<\hat{p}<0.8908\ & \ \ \ &\text{5) Write as an interval and then write your answer in context.}\end{align}\)
We are \(95\%\) confident the true proportion of U.S. adults who use the internet is between \(84.92\%\) and \(89.08\%\) based on our sample proportion.
Example 3: In a survey of \(500\) recently engaged or married women, \(22\%\) said they would change the location of the proposal. Find the \(95\%\) confidence interval for the true proportion of women who would change the location of their proposal. (This video uses \(z^{\ast} = 2\))
Margin of Error: When polls are reported in the news, they usually mention a margin of error with their results. This margin of error represents an interval around the sample proportion and, unless stated otherwise, corresponds to the \(95\%\) confidence interval.
Margin of Error Formula: \(e=z^*\sqrt{\large\frac{\hat{p}\left(1-\hat{p}\right)}{n}}\)
Margin of Error Formula: \(e=z^*\sqrt{\large\frac{\hat{p}\left(1-\hat{p}\right)}{n}}\)
Margin of error is the critical value (number of standard deviations from the sample proportion) times the sample standard deviation.
We can use this formula to solve for error, confidence level or sample size.
If \(\hat{p}\) is unknown, use \(0.50\) (this is called the worst case scenario because it gives you the largest standard deviation and confidence interval).
If confidence level is not stated, assume it is \(95\%\) confidence, so \(z^{\ast} = 1.96\)
Example 4: In a recent survey, \(52\%\) of American workers said their workload increased over the summer. If \(570\) workers were surveyed, what is the margin of error for this poll?
We will assume \(95\%\) confidence, since it is not stated.
\(e=\pm1.96\sqrt{\large{\frac{.52\left(1-.52\right)}{570}}}\)
\(e=\pm.0410\)
The margin of error is approximately \(4.1\%\)
Example 5: In a recent survey of \(1000\) adults, \(24\%\) said they replaced a full meal with snacking \(3-4\) days per week. What is the margin of error associated with a \(95\%\) confidence interval? What is the margin of error associated with \(90\%\) confidence? (Note: for \(95\%\) confidence, this video uses \(z^{\ast} = 2\))
Example 6: A survey of \(580\) people reported a margin of error of \(4.5\%\). What was the level of confidence for the poll?
Example 7: If you are conducting a survey and you want a margin of error of no more than \(3\%\) with \(95\%\) confidence, how many people should be surveyed?
Note: Since the sample proportion is not given, use \(\hat{p}=.50\)
\(\begin{align}&.03=1.96\sqrt{\frac{.5\left(1-.5\right)}{n}}\ & \ \ \ &\text{1) Substitute the values into the formula.}\\
&\frac{.03}{1.96}=\sqrt{\frac{.25}{n}}\ & \ \ \ & \text{2) Isolate the square root.}\\
&\left(\frac{.03}{1.96}\right)^2=\frac{.25}{n}\ & \ \ \ & \text{3) Square both sides.}\\
&.000234=\frac{.25}{n}\ & \ \ \ & \text{4) Calculate.}\\
&.000234n=.25\ & \ \ \ & \text{5) Multiply both sides by n.}\\
&n=\frac{.25}{.000234}\ & \ \ \ & \text{6) Solve for n.}\\
&n\approx1068\ & \ \ \ & \text{7) Round to a whole number, since you cannot survey a fraction of a person!}\end{align}\)
You would need to survey \(1068\) people. This actually means you will need \(1068\) responses, so you will actually have to survey more than \(1068\) people to account for non-response.
Example 8: In a recent survey, \(32\%\) of Americans said they would use their tax refund to pay off debt. Assuming \(95\%\) confidence and a margin of error of \(3\%\), how many people were surveyed? (Note: in this video we are using \(z^{\ast}=2\))