
|
|
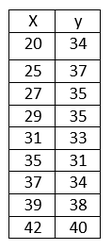
For #1-6, use the given data from the table:
1) Sketch a scatter plot of the data. What type of relation appears to exist?
2) Based on your answer to #1, find a model that best describes the relation. Round your coefficients to the nearest hundredth.
3) Using your EXACT function, predict the output when \(x\) is \(23.3\). Round to the nearest tenth.
4) Using your EXACT function, predict the input when \(y\) is zero. Round to the nearest tenth.
5) Using your EXACT function, predict the input when \(y\) is \(42\). Round to the nearest tenth.
6) Using your EXACT function, predict the input when \(y\) is \(34.2\). Round to the nearest tenth.
Solution Bank