Graphing with a Calculator
Quadratic functions can also be graphed using a graphing calculator. In addition, the x-intercepts, and maximum and minimum values can be found with technology instead of using algebraic methods.
The screenshots give the directions for graphing, finding the x-intercepts and calculating maximum or minimums.
Remember, the x-intercepts are called zeros of the function because they are the values of x when y = 0. The maximum or minimum value occurs at the y-coordinate of the vertex.
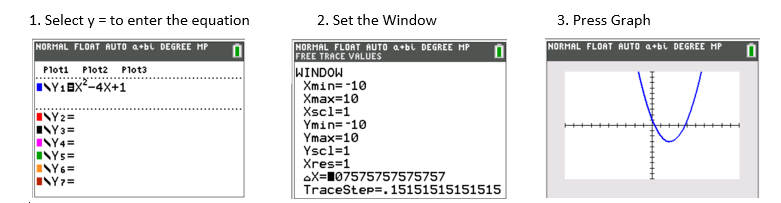
To Graph:
Quadratic functions can also be graphed using a graphing calculator. In addition, the x-intercepts, and maximum and minimum values can be found with technology instead of using algebraic methods.
The screenshots give the directions for graphing, finding the x-intercepts and calculating maximum or minimums.
Remember, the x-intercepts are called zeros of the function because they are the values of x when y = 0. The maximum or minimum value occurs at the y-coordinate of the vertex.
To Graph:
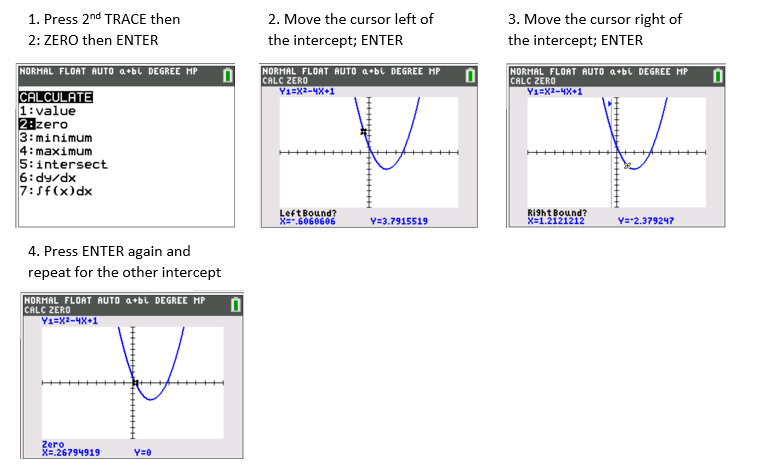
To find x-intercepts:
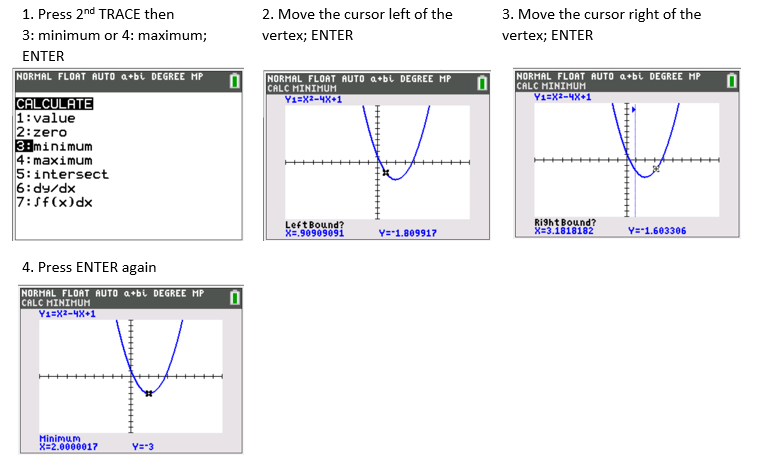
To find the maximum or minimum:
Example 1: Find the x-intercepts, and the maximum or minimum value of the quadratic function \(f\left(x\right)=-\frac{1}{2}x^2-3x+5\).

