|
Trigonometry
|

|
Think about a graph that represents the distance from the ground of a person riding a ferris wheel. Try to describe the shape of this graph in words...no pencil and paper!
Think about a graph that represents the temperature in Chicago over the course of \(10\) years. Try to describe the shape of this graph in words...again, no pencil and paper. |
The reason we found exact value trig ratios for the quadrantal angles is so we can use them when graphing sine and cosine functions.
If you haven’t looked at the investigation yet for this target, now would be a good time to take a look at it, as it will give you insights into the graphing that will be explained in this lesson.
We will be graphing functions of the form \(f\left(x\right)=A\sin\left(\omega x\right)+k\) and \(f\left(x\right)=A\cos\left(\omega x\right)+k\).
The graph of \(f\left(x\right)=A\sin\left(x\right)\) is shown in red and the graph of \(g\left(x\right)=A\cos\left(x\right)\)$ is shown in blue. To turn off either graph, just click on the circle to the left of the function. You can adjust the values of \(A\), \(\omega\) and \(k\) using the sliders. Explore the similarities and differences between sine and cosine, as well as the effects of \(A\), \(\omega\) and \(k\).
Quick Check
1) How does changing the \(A\) value affect the graph?
2) How does changing the \(\omega\) value affect the graph?
3) How does changing the \(k\) value affect the graph?
Quick Check Solutions
1) How does changing the \(A\) value affect the graph?
2) How does changing the \(\omega\) value affect the graph?
3) How does changing the \(k\) value affect the graph?
Quick Check Solutions
Let’s define some key terms before we look at how to graph these functions.
Amplitude (\(A\)) is half the distance between the minimum and maximum values of the function. For our purposes, we can consider it as the distance from the midline to the max or min of the graph.
The midline of the graph is the line \(y = k\) (which is the x-axis for the parent function) and it is the line where the graph will repeatedly intersect. It is halfway between the max and the min of the graph.
The period (\(T\)) of the function is the horizontal distance (in degrees or radians) that it takes for the graph to complete one full cycle. For the parent function, this represents one lap around the circle. As the \(\omega\) value changes, it could take more degrees or radians or fewer degrees or radians to complete this cycle.
The period of \(f\left(x\right)=A\sin\left(x\right)\) and \(g\left(x\right)=A\cos\left(x\right)\) is \(360^{\circ}\) or \(2\pi\) radians.
- If \(\left|A\right|>1\), there is a vertical stretch.
- If \(0<\left|A\right|<1\), there is a vertical compression.
- If A is negative, the graph reflects over the x-axis.
The midline of the graph is the line \(y = k\) (which is the x-axis for the parent function) and it is the line where the graph will repeatedly intersect. It is halfway between the max and the min of the graph.
- If \(k\) is positive, the midline is above the x-axis.
- If \(k\) is negative, the midline is below the x-axis.
The period (\(T\)) of the function is the horizontal distance (in degrees or radians) that it takes for the graph to complete one full cycle. For the parent function, this represents one lap around the circle. As the \(\omega\) value changes, it could take more degrees or radians or fewer degrees or radians to complete this cycle.
- If \(\omega>1\), the graph repeats more often in one revolution around the circle.
- If \(0<\omega<1\), the graph repeats less often in one revolution around the circle.
The period of \(f\left(x\right)=A\sin\left(x\right)\) and \(g\left(x\right)=A\cos\left(x\right)\) is \(360^{\circ}\) or \(2\pi\) radians.
How do we go about actually graphing these functions?
Keep in mind that when we are graphing, \(x\) represents the angle and \(f\left(x\right)\) represents the ratio. So we are plotting angles on the x-axis and the sine or cosine ratio for that angle on the y-axis.
Now that you know what the points you are plotting represent, there are a few other things to consider.
1. You need to find the period of the function. We use the formula \(T=\large\frac{2\pi}{\omega}\) to find the period (which tells us how many
radians it takes for the function to complete one cycle).
2. Graph the line \(y = k\). This is a good starting point (it’s like a new x-axis). It might be a good idea to use a dashed line
for the midline, so it does not get confused with the x-axis.
3. Find the y-intercept of the graph -- sine has a y-intercept at \(\left(0,k\right)\) and cosine at \(\left(0,k+a\right)\). Plot the y-intercept.
4. From the y-intercept, we are just following a pattern of angles and ratios that are derived from the trig ratios for the quadrantal angles. We will plot \(5\) total points to complete one period/cycle of the graph. As a refresher, the ratios for
the quadrantal angles are shown.
\(\sin\left(0\right)=0,\ \sin\left(\frac{\pi}{2}\right)=1,\ \sin\left(\pi\right)=0,\ \sin\left(\frac{3\pi}{2}\right)=-1,\ \sin\left(2\pi\right)=0\)
\(\cos\left(0\right)=1,\ \cos\left(\frac{\pi}{2}\right)=0,\ \cos\left(\pi\right)=-1,\ \cos\left(\frac{3\pi}{2}\right)=0,\ \cos\left(2\pi\right)=1\)
Note, we multiply the ratios by the \(A\) value to determine how many units we move up or down from the midline.
5. The graph is not complete until you label the x-axis with the units. This always seems to cause some confusion. The
units represent the angles for each ratio. If the period is \(2\pi\), the units on the x-axis will just be the quadrantal angles.
But if the period is not \(2\pi\), the units are found by multiplying the period by \(\frac{1}{4}\).
Do not confuse the units (scale) on the x-axis with the period. They are two separate things.
6. You should graph at least \(2\) periods (cycles) of the function.
Example 1: Graph the equation \(y=2\sin\left(3x\right)-1\).
Example 2: Graph the equation \(y=-3\cos\left(\pi x\right)+2\).
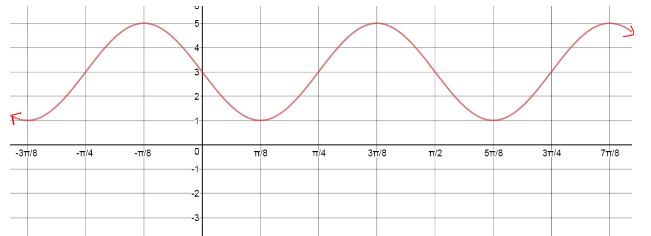
We can also write the equation of the function from a graph.
Example 3: Write the equation of the function shown:
1. Determine if the graph is sine or cosine based on the y-intercept. This is a cosine function.
2. Find the amplitude (\(A\)). \(A = 4\)
3. Find the \(k\) value. \(k = -2\)
4. Solve for \(\omega\). To do this, identify the period (\(T\)) of the function by looking at the x-axis and determining the angle at which the graph has completed one cycle. Then solve the equation \(T=\frac{2\pi}{\omega}\) for \(\omega\).
\(T=\frac{2\pi}{3}\). Solve \(\frac{2\pi}{3}=\frac{2\pi}{\omega}\)
\(\omega=3\)
(This was an easy one because the numerators are the same. You can always solve using a cross product.)
5. Put it all together! \(f\left(x\right)=4\cos\left(3x\right)-2\)
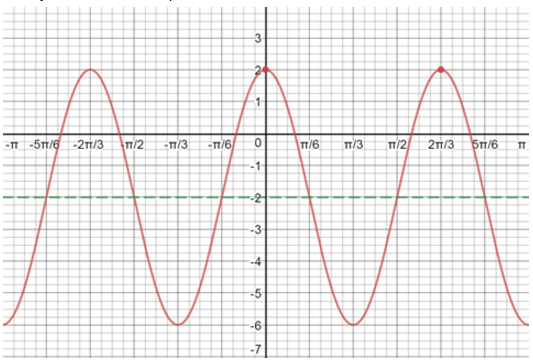
Example 4: Write the equation of the function shown in the graph.