
|
Exponential and Logarithmic Functions
|

|
Option 1: You are paid \(\$1000\) a year for \(\$20\) years.
Option 2: You are paid \(\$1\) the first year, \(\$2\) the second year, \(\$4\) for the third year, doubling the amount each year. Which option would you choose and why? |
We are first going to look at graphing exponential functions of the form \(y=ab^x\). You have graphed these functions in a previous course, but we are going to add several more transformations. In \(y=ab^x\), the base, \(b\) , must be in the interval \((0,1)\cup(1,\infty)\). Why does the base have to be positive but not equal to \(1\)? If \(b<0\), you will run into issues with taking certain roots of negative numbers that are not real numbers. If \(b=0\), you would have problems with undefined numbers if the exponents are negative and a boring constant function equal to \(0\) if the exponents are positive. If \(b=1\), the graph is a horizontal line \(f(x)=1\) since \(1\) to any power is just \(1\).
Let's look at two of the most common exponential functions with \(a=1\): \(f(x)=2^x\) and \(f(x)=\left(\large\frac{1}{2}\right)^x\).
Below is the graph of \(f(x)=2^x\). Some key points that can help you graph this by hand are shown in the table below.
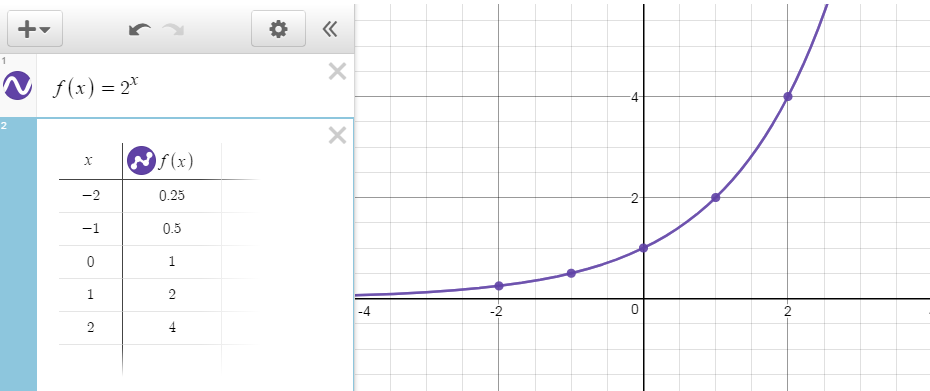
Remember that \(2^{-2}= \large\left(\frac{1}{2}\right)^{2}=\large\frac{1}{4}\).
Quick Check #1
1) What is the domain of this function?
2) What is the range?
3) What is the \(y\)-intercept?
4) What is the end behavior?
Quick Check Solutions
1) What is the domain of this function?
2) What is the range?
3) What is the \(y\)-intercept?
4) What is the end behavior?
Quick Check Solutions
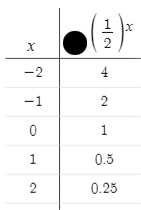
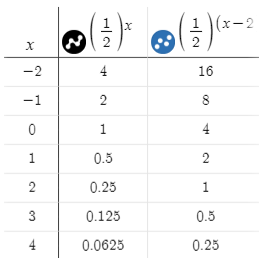
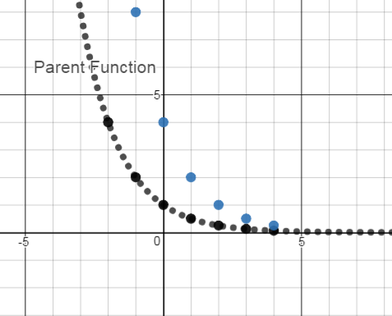
Now let’s look at the graph of \(f(x)=\left(\large\frac{1}{2}\right)^x\). Below is a table with the same \(x\)-values as above. What similarities and differences do you notice?
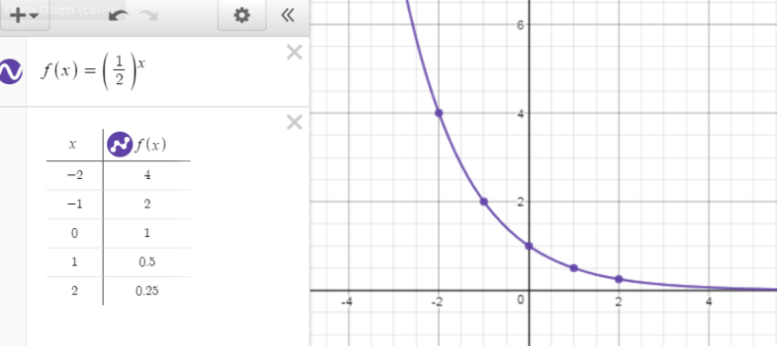
The domain, range, \(y\)-intercept, and horizontal asymptote are the same for both functions.
To summarize, a function of the form \(y=ab^x\) with \(a =1\) is an exponential growth function if \(b >1\) and an exponential decay function if \(0 < b < 1\).
Now let’s explore exponential functions of the form to see the effects that and have on the graph. You have worked with these same transformations in other functions (linear, quadratic, polynomial, etc.), and these transformations will be applied the same way to exponential functions.
What effect does \(a\) have on the graph?
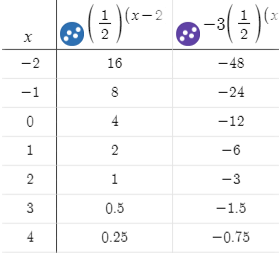
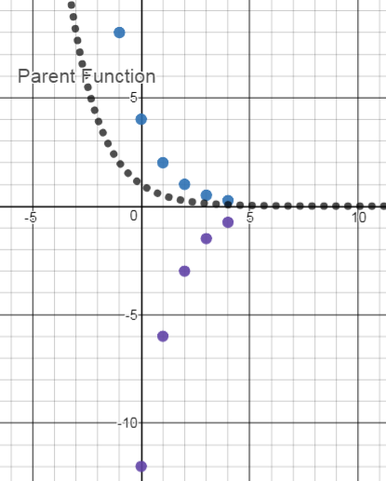
- \(a\) is a vertical stretch or compression on the graph. If \(a>0\) the graph will be vertically stretched (each \(y\) value will be multiplied by \(a\)). If \(0<a<1\), the graph will be vertically compressed (each \(y\)-value will be multiplied by \(a\)). If \(a<0\), then the graph will be reflected in the \(x\)-axis.
What effect does \(h\) have on the graph?
- \(h\) creates a horizontal shift on the graph. The parent function is shifted \(h\) units horizontally. Remember that the form is \((x-h)\) so, for example, \((x - 2)\) means that \(h = 2\) which shifts the graph \(2\) units to the right and \((x + 5)\) means that \(h = -5\) and would shift the graph left \(5\) units.
What effect does \(k\) have on the graph?
- \(k\) creates a vertical shift on the graph. The parent function is shifted \(k\) units vertically. This will also affect the horizontal asymptote, range, and end behavior.
When you are applying the transformations, remember to always follow order of operations. You should apply the horizontal shift first, then the vertical stretch/compression, and finally the vertical shift.
Example 1: Graph the function and give its domain, range, and horizontal asymptote: \(f\left(x\right)=-2^{\left(x+4\right)}-5\).
Example 2: Graph the function and give its domain, range, and horizontal asymptote: \(f\left(x\right)=2\left(\frac{1}{3}\right)^{\left(x+1\right)}\).
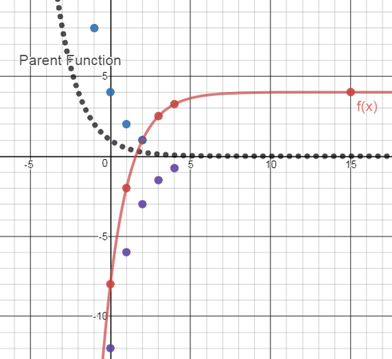
Example 3: Graph the function \(f(x)=-3\left(\frac{1}{2}\right)^\left(x-2\right)+4\) and give its domain, range, and horizontal asymptote.
|
1) Graph the parent function.
|
|
|
2) Shift every coordinate right two units.
|
|
|
3) Vertically stretch by a factor of 3 and reflect over the x-axis (multiply y-values by -3).
|
|
|
4) Shift up 4 units.
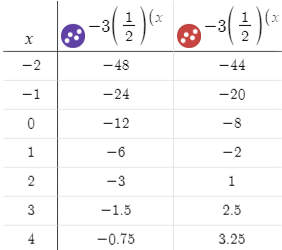
Domain: \(\left(-\infty,\infty\right)\)
Range: \(\left(-\infty,4\right)\) HA: \(y=4\) |
|