Use technology to approximate a line of best fit for a set of data.
We can also use linear equations to model a set of data. This is called regression, and we can use technology to find this equation of best fit. Below is a scatter plot of a set of data and the line of best fit for that data. As you can see, it does not perfectly fit the data (no line would be able to do that) but it does allow us to predict and generalize quite well.
We can also use linear equations to model a set of data. This is called regression, and we can use technology to find this equation of best fit. Below is a scatter plot of a set of data and the line of best fit for that data. As you can see, it does not perfectly fit the data (no line would be able to do that) but it does allow us to predict and generalize quite well.

This particular set of data has a negative correlation which means that as one of the variables increases, the other variable decreases. We can see that by the equation for the line of best fit having a negative slope. The equation of the line shown in the graph above has a slope of \(y=-.452x+2.411\). We can use this to make predictions about the set of data. We have to be careful to not go far outside of the given data which in this case has a domain of \(-3\le x\le7\) and a range of \(-1\le y\le4\).
When we find a regression equation, we are also given a correlation coefficient, \(r\). This value can range anywhere from \(-1\) to \(1\) and tells us how well the regression equation fits the data. The sign of the \(r\)-value tells us whether the data has positive or negative correlation. If \(r=1\ \text {or}\ r= -1\) or , then the equation fits the data perfectly (in other words, all the points would be exactly on the line). If \(r=0\), the equation does not fit the data at all. So the closer the \(r\) -value is to \(1\) or \(-1\), the better the equation fits the data. The \(r\) -value for the example above is \(-.9389\) which is very close to \(-1\) and would indicate that the data has a strong negative linear correlation.
In order to use your graphing calculator to find the line of best fit, you must first put the data into your calculator. The steps for this are below.
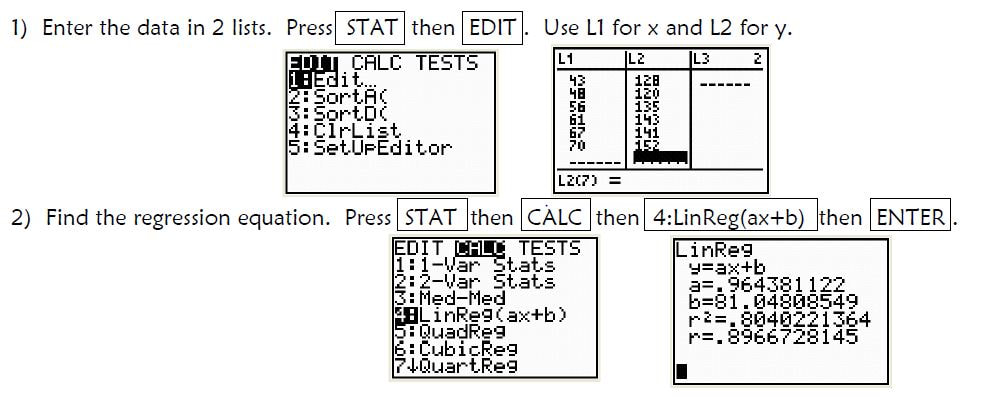
If your calculator is not showing the \(r\)-value, then press 2ND then ZERO to bring up the Catalog. Scroll down to DiagnosticsOn (it is alphabetical) and press ENTER twice. If you repeat the steps for finding the regression equation, the \(r\)-value should now show up.
If you would like to use Desmos to do regression instead, click here for a self-guided tutorial to learn how.
Example 1: The table below shows the student enrollment at a small but growing private school. Let represent the years since \(2012\) and \(y\) represent the enrollment at the school. Find the linear equation of best fit, the correlation coefficient, and use it to predict the enrollment at the school in the year \(2020\) .
\(x\) |
\(0\) |
\(1\) |
\(2\) |
\(3\) |
\(4\) |
\(5\) |
\(6\) |
\(y\) |
\(102\) |
\(109\) |
\(128\) |
\(133\) |
\(131\) |
\(142\) |
\(159\) |
Quick Check
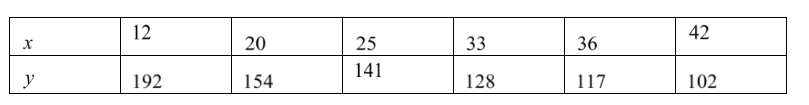
Find the linear equation of best fit for the data in the table below. Also find the correlation coefficient and use the equation to predict the \(y\)-value when \(x=40\).
Quick Check Solutions
Find the linear equation of best fit for the data in the table below. Also find the correlation coefficient and use the equation to predict the \(y\)-value when \(x=40\).
Quick Check Solutions