Higher Order Inequalities
A sign graph shows the sign (positive or negative) for a particular interval of a given polynomial. Sign graphs are useful to solve inequalities. The first example will show us how to make a sign graph and from there, we'll look at how to use sign graphs when solving inequalities.
Example 1: Show the sign graph for the polynomial: \(x^3+4x^2-5x\).
Example 2: Solve the inequality: \(25x^2>49\).
\(\begin{align}&25x^2-49>0\ & \ \ \ \ &\text{1) Subtract the 49 so that the polynomial can be factored.}\\
&\left(5x+7\right)\left(5x-7\right)>0\ & \ \ \ \ &\text{2) Factor the polynomial.}\end{align}\)
The zeros of the polynomial equation, \(\left(5x+7\right)\left(5x-7\right)=0\), are \(-\large\frac{7}{5}\ \normalsize\text{and}\ \large\frac{7}{5}\)
Plot these zeros on a number line to create a sign graph.
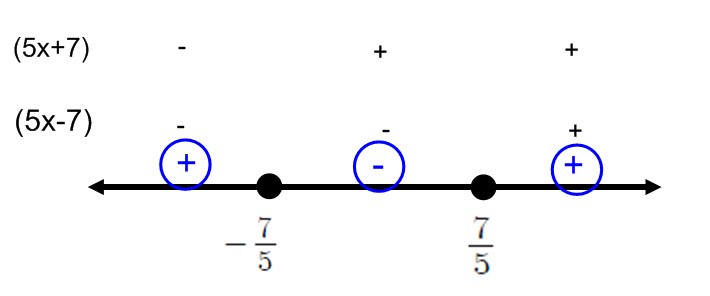
The inequality asked us to find the positive interval(s) for when the polynomials is greater than \(0\). According to our sign graph, the solutions are \(x<-\large\frac{7}{5}\ \normalsize\text{or}\ \ x>\large\frac{7}{5}\).
Example 3: Solve the inequality: \(x^3+2x^2\le4x+8\).
Example 3: Solve the inequality: \(x^3+2x^2\le4x+8\).

