|
Quadratic Functions
|

|
SAT Practice Question:
\(R(q)=-0.3(q - 260)^2+9500\) A shoe manufacturer determines that it's monthly revenue, \(R(q)\), is given by the function defined above, where \(q\) is the number of pairs of shoes sold each month. What is the maximum value of the company's monthly revenue in dollars? Source: Khan Academy |
Often we are asked to write a quadratic function given points on a graph or given the graph of the function. Depending on the information given, you will choose the appropriate model--either the vertex form or the intercept form.
Vertex Form: \(f\left(x\right)=a\left(x-h\right)^2+k\)
Use vertex form when you are given the vertex and one other point on the graph.
Intercept Form: \(f\left(x\right)=a\left(x-p\right)\left(x-q\right)\)
Use intercept form when you are given the two x-intercepts and one other point on the graph.
Vertex Form: \(f\left(x\right)=a\left(x-h\right)^2+k\)
Use vertex form when you are given the vertex and one other point on the graph.
Intercept Form: \(f\left(x\right)=a\left(x-p\right)\left(x-q\right)\)
Use intercept form when you are given the two x-intercepts and one other point on the graph.
The steps to follow when writing the function are similar regardless of which model you will use.
1. Choose the appropriate model based on the given information and substitute in either the vertex or the intercepts.
- Use the vertex form if you are given the vertex \(\left(h,\ k\right)\).
- Use the intercept form if you are given the x-intercepts (\(x = p\) and \(x = q\)).
- Using the given point, substitute the \(x\) and \(y\) values into the equation.
- Follow the correct order of operations to solve for \(a\).
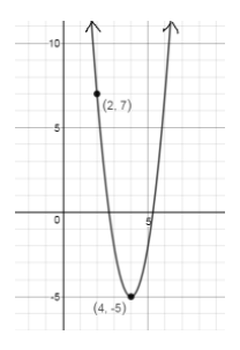
Example 1: Write a quadratic function for the parabola shown.
|
\(\begin{align}&y=a\left(x-h\right)^2+k\ & \ \ \ &\text{ 1) Since the vertex is given, use vertex form.}\\ &y=a\left(x-4\right)^2-5\ & \ \ \ &\text{ 2) Substitute the \(4\) for \(h\) and \(-5\) for \(k\).}\\ &7=a\left(2-4\right)^2-5\ & \ \ \ &\text{ 3) Substitute \(2\) for \(x\) and \(7\) for \(y\) into the above equation.}\\ &12=a\left(-2\right)^2\ & \ \ \ &\text{ 4) Solve for \(a\).}\\ &12=a\cdot4\ & \ \ \ &\text{ 5) Evaluate the exponent.}\\ &3=a\ & \ \ \ &\text{ 6) Divide.}\\ &f\left(x\right)=3\left(x-4\right)^2+5\ & \ \ \ &\text{ 7) Write the function.}\end{align}\) |
Example 2: Write a quadratic function whose graph has a vertex of \(\left(-3,-1\right)\) and passes through the point \(\left(-5,-7\right)\).
Example 3: Write a quadratic function with x-intercepts \(\left(-4,0\right)\) and \(\left(3,0\right)\) that passes through the point \(\left(5,8\right)\).
\(\begin{align}&y=a\left(x-p\right)\left(x-q\right)\ & \ \ \ &\text{ 1) Since the x-intercepts are given, use intercept form.}\\
&y=a\left(x-\left(-4\right)\right)\left(x-3\right)\ & \ \ \ &\text{ 2) Substitute \(-4\) for \(p\) and \(3\) for \(q\).}\\
&y=a\left(x+4\right)\left(x-3\right)\ & \ \ \ &\text{ 3) Distribute the negative.}\\
&8=a\left(5+4\right)\left(5-3\right)\ & \ \ \ &\text{ 4) Substitute \(5\) for \(x\) and \(8\) for \(y\) in the above equation.}\\
&8=a\left(9\right)\left(2\right) \ & \ \ \ &\text{ 5) Solve for \(a\).}\\
&8=18a \ & \ \ \ &\text{ 6) Multiply.}\\
&\frac{8}{18}=a \ & \ \ \ &\text{ 7) Divide.}\\
&\frac{4}{9}=a \ & \ \ \ &\text{8) Reduce the fraction.}\\
&f\left(x\right)=\frac{4}{9}\left(x+4\right)\left(x-3\right)\ & \ \ \ &\text{ 9) Write the function.}\end{align}\)
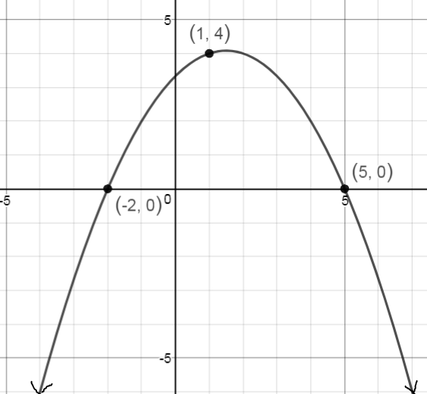
Example 4: Write a quadratic function for the parabola shown:
We will also write quadratic models using regression on the calculator (similar to linear regression from Unit 1). To refresh your memory on how to input the data and calculate the regression equation, review the steps and screenshots below.
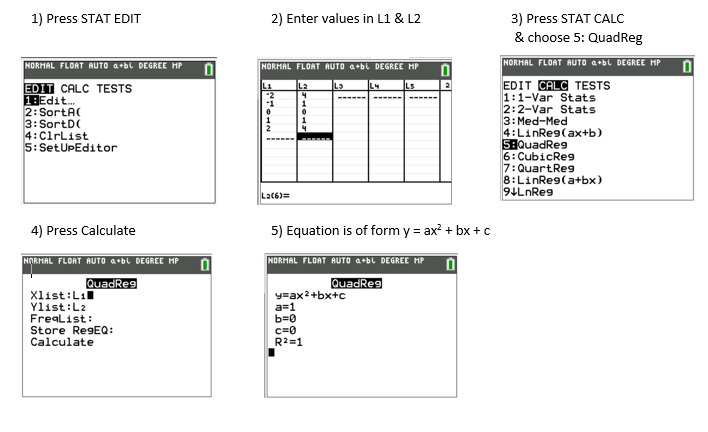
- The calculator defaults to List 1 and List 2, but you may use any list you want as long as you identify those lists in Step 4 above.
- If you do not have List 1 or List 2, Select 5: SetUpEditor from Step 1 then ENTER
- Clear all lists before entering new data by highlighting the list name in Step 2 then pressing CLEAR and ENTER.
- The \(R^2\) value is the coefficient of determination. If you do not have this shown, you can turn the diagnostics on by pressing 2nd 0 (catalog menu) and scroll down to DiagnosticOn and press enter. The coefficient of determination can help us determine if the regression equation is a good model (similar to correlation coefficient).
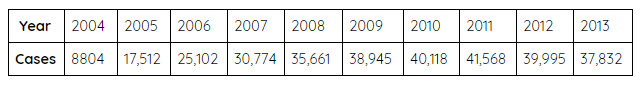
Example 5: The number of AIDS cases reported for people under age \(21\), according to the CDC, are shown in the table below. Find the quadratic model for this data, letting \(0\) represent the year \(2004\). Then predict the number of AIDS cases that will be reported in \(2017\).